The right calculator can streamline statistics homework, data analysis, and test prep. This guide highlights five widely used models ideal for college statistics courses, including scientific and graphing capabilities, regression analysis, and complex-number features. Each product is evaluated on display quality, function breadth, ease of use, and portability to help you choose the best tool for your curriculum and study habits.
| Product | Key Features | Display Type | Notes |
|---|---|---|---|
| Casio fx-115ES Plus 2nd Edition | 280+ functions, Natural Textbook Display | 4-line LCD | Great for statistics, calculus, and engineering tasks |
| Texas Instruments TI-84 Plus CE | Color graphing, preloaded apps | Color backlit | Strong for graphing and data analysis in statistics courses |
| CATIGA CS-229 | Graphic functions, 360+ functions | Graphics display | All-in-one scientific and graphing tool |
| CATIGA CS-121 | Graphing with multiple modes, 360+ functions | Graphing display | Compact and ergonomic for daily use |
| iPepul 991ES Plus | 417 functions, solar power | Four-line display | Affordable option with natural display |
Selected models balance price, capability, and classroom practicality. The Casio and TI units are staples in many curricula, while CATIGA and iPepul provide versatile, budget-friendly alternatives with robust function sets. Read on to explore each option in detail and compare how they align with college statistics coursework, including regression, hypothesis testing, and data visualization needs.
Casio fx-115ES Plus 2nd Edition

The Casio fx-115ES Plus 2nd Edition offers NATURAL TEXTBOOK DISPLAY℠ to show fractions, equations, and results as they appear in textbooks, easing interpretation during statistics problems. With over 280 functions, this unit supports complex number calculations, linear regression, summation, integration, permutations and combinations, and matrix/vector operations. Its blend of scientific and statistical capabilities makes it suitable for courses requiring both standard calculations and data analysis, all in a compact, affordable package.
Texas Instruments TI-84 Plus CE Color Graphing Calculator
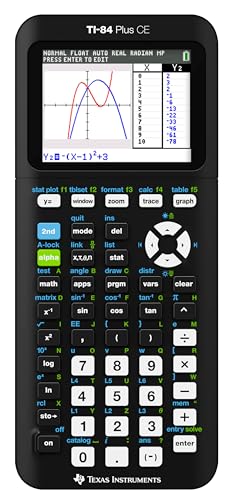
The TI-84 Plus CE is a color graphing calculator with a high-resolution backlit display and split-screen options, supporting graphing, statistics, and data visualization. It includes a rechargeable battery and preloaded apps, enabling efficient exploration of distributions, regression analysis, confidence intervals, and hypothesis testing. Its intuitive interface and robust software ecosystem make it a strong long-term tool for statistics-heavy coursework and exams.
CATIGA CS-229 Scientific Calculator

The CATIGA CS-229 combines scientific and graphing functionality with 360+ functions, including statistics, linear regression, standard deviation, and vector operations. Its compact design prioritizes ergonomic use for long study sessions and test environments. The device supports plotting functions and analyzing graphs, helping students visualize distributions, regression lines, and data trends characteristic of college statistics work.
CATIGA CS-121 Scientific Calculator

The CATIGA CS-121 extends graphing capabilities with multiple modes and 360+ functions, including fractions, trigonometry, and calculus features. Its compact form factor and user-friendly layout make it suitable for daily classroom use and exam prep, enabling efficient input for statistical calculations, data plotting, and regression analysis.
iPepul Pink 991ES Plus Scientific Calculator

The iPepul 991ES Plus delivers 417 calculation functions, including trigonometric, exponential, logarithmic, calculus, and statistics functions. It features a four-line display with natural input-output and a dual power system (solar and battery), supporting consistent use across indoor and outdoor study environments. This option offers substantial functionality at a budget-friendly price point, suitable for statistics work, algebra, and engineering tasks.
Buying Guide
Key factors to consider when selecting a statistics-focused calculator include function breadth, display quality, graphing capabilities, power source, and classroom practicality. Here are essential purchase considerations from multiple perspectives:
- Function coverage: For college statistics, ensure access to regression tools, standard deviation calculations, probability distributions, hypothesis testing support, and matrix or vector operations if analyzing data sets.
- Display and readability: A clear display helps with locating regression results and long equations. NATURAL TEXTBOOK DISPLAY℠ can reduce interpretation errors, especially when learning concepts like fractions and simultaneous equations.
- Graphing capabilities: If your course emphasizes data visualization, a color or graphing model with plotting functions will be beneficial for visualizing distributions and regression lines.
- Power source and portability: A rechargeable battery or solar power can reduce interruptions during extended study sessions or exams. Compact form factors aid in transporting the device between classes.
- User interface and learning curve: Ergonomic design and intuitive button layouts speed up input and reduce cognitive load during timed quizzes or exams.
- Durability and warranty: A sturdy build supports daily use, and a reliable warranty offers protection against accidental damage in a busy student environment.
- Budget considerations: While higher-end graphing calculators offer expansive features, budget-friendly scientific models often provide sufficient functionality for statistics coursework without unnecessary complexity.
- Academic ecosystem compatibility: Some courses prefer specific brands or models due to airport-friendly exam policies or standardized software compatibility; confirm with instructors if possible.
In sum, the best choice depends on your course requirements, your need for graphical visualization, and how comfortable you are with learning advanced functions. The Casio and TI options deliver established reliability and broad feature sets, while CATIGA and iPepul provide strong value with extensive function counts and graphing capabilities. Consider trying a model with a natural display and a robust regression toolkit to optimize your statistics study workflow.